




 1-855-888-NTWC (6892)
 twc@transportcenter.org
Measuring Your Progress
Transit agencies seeking to streamline their operator hiring processes need ways of assessing whether their efforts have been successful, as well as where bottlenecks exist that are causing candidates to drop out of the process. This webpage provides suggestions, based on real-world examples, of ways transit agencies can evaluate their processes.
Tracking Attrition by Stage of Process
One straightforward way to track how many candidates are withdrawing or being disqualified at each stage of the hiring process is to develop a Sankey diagram of the operator hiring process. This type of diagram shows how many individuals are lost at each stage, as well as how many continue to move forward in the process. The below graphic shows an example hiring process using mock data.
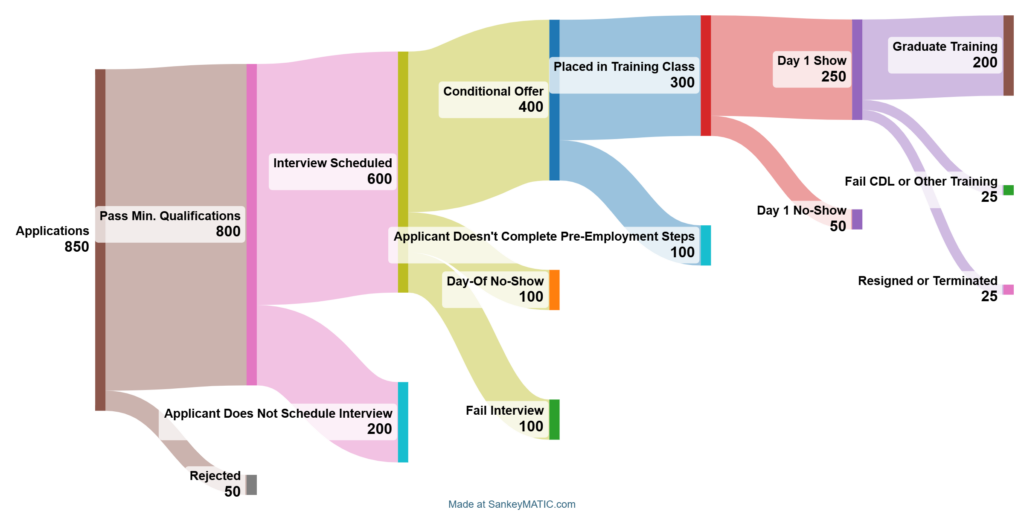
The creation of this diagram might help the example agency recognize that it is losing a high proportion of its candidates at the interview scheduling phase (a quarter of the total number of applicants in the pipeline at that stage). This might be a sign that the transit agency needs to make scheduling the interview easier. By contrast, training at the example agency seems to be relatively effective—only 10% of applicants failed in the example cycle. A Sankey diagram can help transit agencies visualize important ratios such as:
- Number of offers made out of total number of applicants
- Number of individuals starting training out of total accepted offers
- Number of training graduates out of number of interviewees
Other Valuable Metrics Agencies Can Track:
- Number of days each step in the hiring process takes on average, as well as the average length of the total process (i.e., time-to-hire and/or time-to-fill)
- Quality and quantity of hire by recruitment source
- Candidate experience scores (similar to net promoter scores, but among candidates rather than customers)
- Percent of vacancies filled
- Staffing ratios
- Number of applications over number of labor hours spent on hiring processes
- Number of trainees per number of trainers
- Cost per hire
- No-shows on first day of training
- Correlation between test performance and retention
- Turnover or retention in the first year (as an indicator of how well the hiring process did at securing quality candidates)
Spotlight: Ann Arbor Area Transit Authority (AAATA)
AAATA used to have bus operator candidates take a customer service test. In recent years, AAATA’s human resources department noticed that candidates were dropping out at the testing phase due to stress and anxiety about the test. Management conducted an analysis that found no evidence of a strong correlation between candidates’ results on the customer service test and their subsequent job performance, so AAATA dropped the test and switched to behavioral interviewing techniques to assess customer service skills. This example shows how transit agencies can use internal data to assess the effectiveness of each piece of their hiring process.
This page is part of TWC’s Streamlining Operator Hiring Practices research initiative aimed at documenting current transit agency hiring processes for operators and producing new resources to support agencies’ operator hiring efforts. Through background research, an industry survey, and interviews with 15 transit locations, the TWC research team has produced a series of fact sheets, briefs, and other resources focused on various aspects of the hiring process. Check out the initiative landing page to learn more about the project and to see the other resources.
