




 1-855-888-NTWC (6892)
 twc@transportcenter.org
Metrics Monday: Tracking Retention From Insight to Action
Welcome back to Metrics Monday, TWC’s blog series covering workforce-related metrics. This post will focus on retention. As with all workforce metrics, tracking retention helps transit agency leadership better understand their workforces by uncovering trends, comparing between agency job roles, and benchmarking against other transit agencies and area employers. Quality data can help agency leadership make informed decisions about how to improve retention by adapting policies or developing new initiatives. By continuing to look at the data, agencies can assess the effectiveness of program or policy changes or catch early warning signs of turnover.
Retention Metrics
Retention broadly refers to an organization’s ability to keep or retain employees, while retention rate is the number of employees who remain in a specific time period typically represented as a percentage. Calculating retention rate is a great starting point and many transit agencies are already measuring this; it’s most simply calculated by dividing the total employees at the end of a period, excluding new hires for the period, by the total employees at the start of a period, multiplied by 100 (to represent it as a percentage).
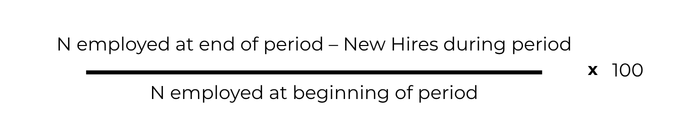
Transit agencies can often leverage existing data to track retention on a more granular level to gain further insights about specific groups. Retention can be broken down by department, job role, or tenure. For example, Dr. Shanta Hejmadi, Principal Data Scientist at Metro Transit in Minneapolis/St. Paul, Minnesota, compared the first-year bus operator retention to retention rates for other employee categories across multiple years. Metro Transit tracks multiple retention rates, including two bus operator-specific rates:
- 12-month retention rate is found by calculating the number of people employed in a given month who were still employed 12 months later divided by the original number employed in that month.
- First-year retention rate is found by calculating the number of employees hired or rehired in a given month who were still employed 12 months later divided by the total number hired in that month.
- Second-year plus retention rate is found by calculating the number of employees who have passed their 1-year anniversary in a given month and dividing the number who were still employed 12 months later by the total number of employees.
- Bus operators’ retention through training is found by calculating the number of employees hired or rehired in a given calendar year who were still employed 7 weeks later, divided by the total number hired in that calendar year. (This metric continues to change until 8 weeks into the new year.)
- Bus operators’ 6-month retention is found by calculating the number of employees hired or rehired in a given calendar year who were still employed 26 weeks later, divided by the total number hired during that calendar year. (This metric continues to change until 27 weeks into the new year.)
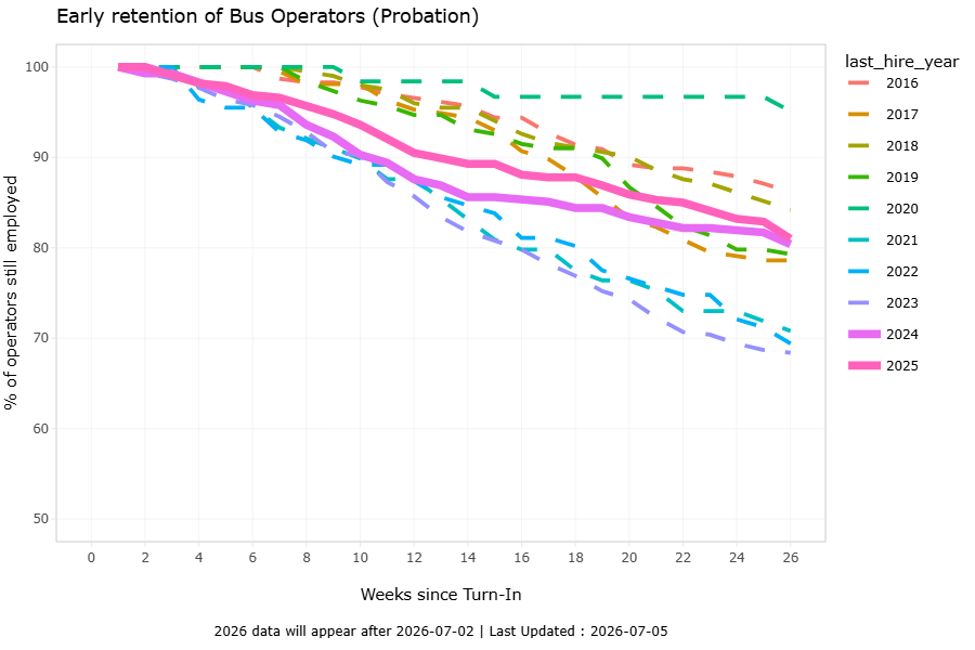
- Bus operators’ retention through probation is found by is found by calculating the number of employees who “turned in” (i.e. completed training) in a given calendar year who were still employed 26 weeks later, divided by the total number who turned in during that calendar year. (This metric continues to change until 27 weeks into the new year.)
Metro Transit uses a rolling average of 12-month retention rates to smooth out any outlying numbers that may cause jumps in a given month. A rolling average, sometimes called a moving average, is the average of a subset of a dataset, often used in time series data (like retention across months) to smooth out short-term fluctuations so that it’s easier to assess long-term trends and patterns.
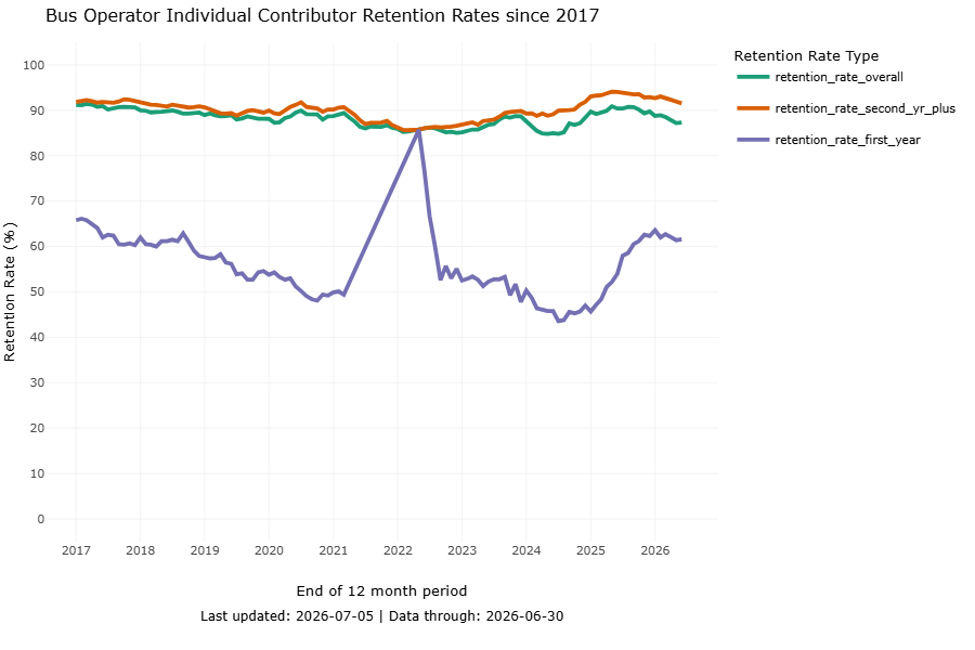
Dr. Hejmadi found a much lower retention rate for first-year bus operators than second-year onward bus operators. Using this information, Metro Transit leadership decided to increase the length of training by two weeks for bus operators to provide them with additional support and knowledge. Over the next two years, Metro Transit found that the retention rate for first-year bus operators had improved dramatically compared to the years prior to the training program change.
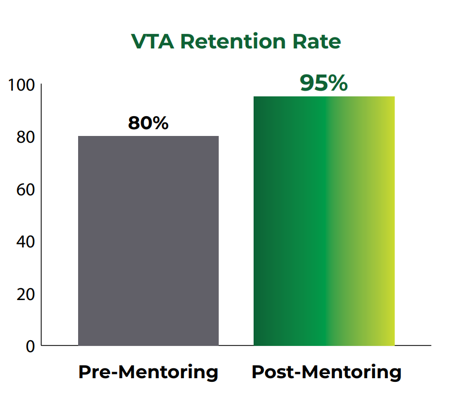
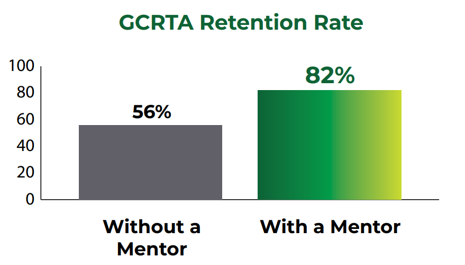
Agencies without a dedicated data team or agencies that are new to workforce data collection may consider starting with the simple retention equation. Retention rates can be calculated in a spreadsheet and depicted in a number of ways; line charts are effective at showing time series data because they highlight trends over time well, as shown in Metro Transit’s example. Alternatively, retention between roles or before and after an initiative begins may be best shown in a column chart, which can better emphasize differences between categories or before and after a particular event (as shown below with examples from TWC’s Mentorship Metrics fact sheet).
Turnover Metrics
Though ultimately measuring similar concepts, it can be helpful in some cases to focus on turnover, employees leaving the agency, rather than retention. While retention is well-suited for situations like looking at the shared characteristics of a cohort of workers who begin around the same time, turnover might be more useful for considering overall conditions at an agency.
Turnover rate is typically calculated by dividing the number of employees who have left during a specific time period by the average number of people employed during the period, multiplied by 100 to represent it as a percentage.
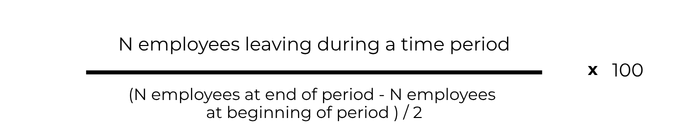
In contrast to typical retention rate, turnover rate usually takes into account new hires by finding the average employment in the time period, which can be calculated by adding the number of people employed at the beginning and end of the period and dividing by two.
An agency can analyze both voluntary and involuntary turnover, meaning whether the employee leaves on their own versus being let go. A high voluntary turnover might indicate challenges or areas for improvement within the agency that are causing employees to leave. Agencies can further narrow down the root causes by conducting exit interviews with employees who are leaving; for smaller agencies, even a brief, informal exit interview with a simple question asking for the reason for leaving can help provide more context. For example, bus operators have demanding and sometimes irregular schedules that may be difficult for some people, such as parents of young children, to manage. Depending on how many people are leaving for this reason, an agency may consider childcare options to help retain some of these employees. On the other hand, a high involuntary turnover rate might reflect issues with hiring practices and finding the best fit candidates for the role. Check out TWC’s Streamlining Operator Hiring Practices research initiative to learn more about common strategies and best practices in bus operator hiring that promote the selection of best fit candidates.
Possible Data Sources of Turnover Reasons
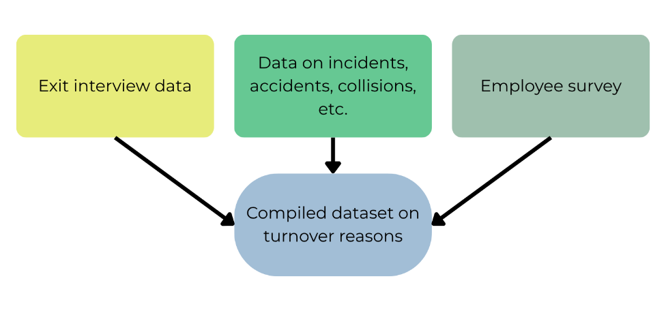
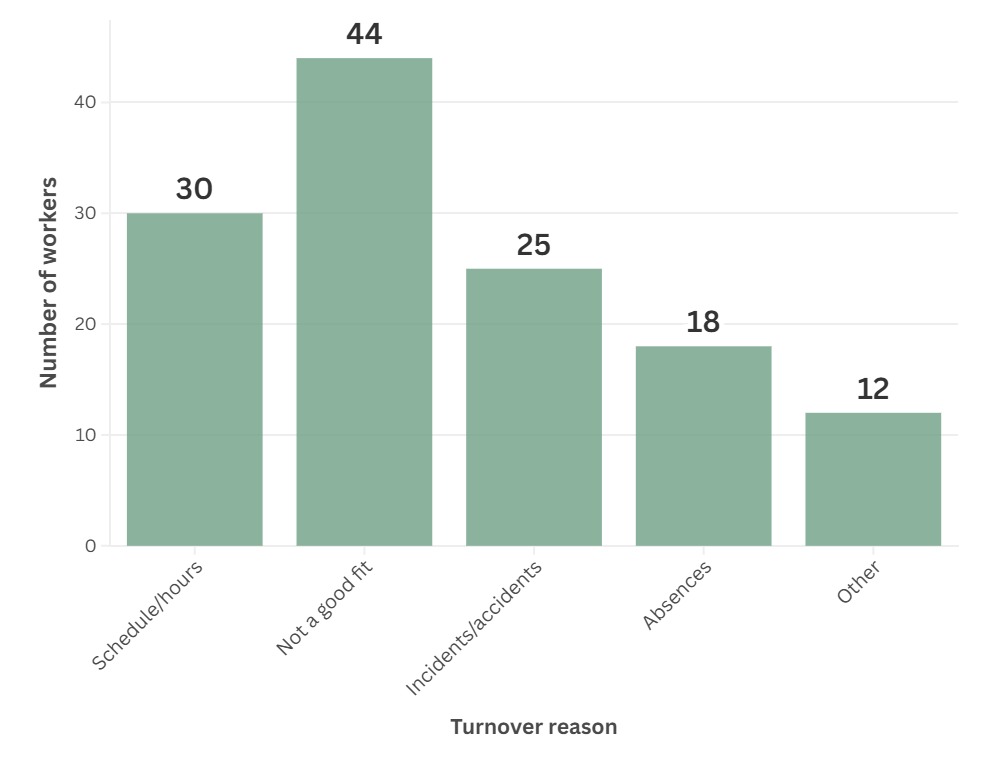
For positions that require a lot of training, high involuntary turnover that results from issues with performance could also indicate challenges with training. Bus operators typically require several weeks of training; high turnover resulting from incidents or accidents could suggest that training is not sufficient. Transit agencies that track reasons for involuntary turnover can use those data as a basis for making changes to training and later monitor if performance-based reasons, such as accidents, decrease. Most transit agencies are likely already tracking incidents and accidents and may just need to connect those data to workforce data to analyze involuntary turnover resulting from these events. A column chart can show the number of people leaving for a given reason (see the example below) and, as with retention rates, can be used to compare turnover before and after an event or initiative.
Number of Workers Turned Over by Reason for Leaving (mock data)
In addition to number or rate of employee turnover, agencies may also consider calculating cost of turnover. Not only can high turnover cause service disruption and be reflective of other organizational challenges, but it also comes with a high cost through recruiting and training new employees and lost productivity. Work Institute estimates that employee departures can cost 33 to 200 percent of their annual salary. There are varied methods for calculating cost of turnover and online tools to help make estimations.
Other Related Metrics
In addition to voluntary and involuntary turnover, transit agencies can measure other ways that employees leave their role or the workforce, including transfers and retirements.
Tracking transfers can help agencies assess their organizational or departmental cultures; if fewer people voluntarily leave the agency and instead transfer to another role or department, it might suggest a positive organizational culture and strong career pathways that encourage workers to stay with the agency. On the other hand, if a lot of people transfer out of a specific role, even if they’re staying with the agency, it could be a sign that the role is too demanding or otherwise less appealing. Transfer data is an example of data that likely already exists within agencies and might need to be pulled from human resources management software and/or connected to other data sources. The data may be in the form of employee records of start and end dates by role with multiple entries per person if they have transferred or been promoted. It can be helpful for analyzing the data to create a separate dataset, using information from the employee records, that lists the transfers and promotions as rows rather than employees as rows.
Transit agencies can also consider tracking retirements, particularly retirements over time or signs of an impending increase in retirements, which could indicate the need for succession planning and provide an impetus for strengthening career pathways to fill roles with existing workers.
Tracking retention and turnover rates may uncover areas for improvement, whether it be agency-wide, departmental, or for a specific role. There are many strategies agencies might consider employing to better retain workers, many of which TWC provides resources for and information about. As described earlier, some bus operators may leave their role due to tough schedules making childcare difficult; TWC has mini case studies on several approaches to childcare in the transit industry. TWC also has several case studies about improving job quality, which is a large factor in employee retention, and several case studies about mentorship and apprenticeship, which have been shown to improve retention. In addition to case studies, TWC has an apprenticeship page highlighting more resources. Whatever initiatives or programs transit agencies may choose to implement, it’s important to continue monitoring retention to assess the impact of those initiatives and programs.
Further reading:
- Tracking Your Impact – in this presentation from TWC’s 2024 Making Connections Conference, Dr. Shanta Hejmadi discusses tracking retention of bus operators at Metro Transit, MN
- Transit Mentorship Metrics: Positive Signs for Retention, Attendance, and Additional Outcomes
- Data Literacy Initiative from the National Center for Applied Transit Technology (N-CATT)
- How to Build a Data Dashboard Free On-Demand Course from N-CATT
- TCRP Report 162: Building a Sustainable Workforce in the Public Transportation Industry—A Systems Approach, in particular, Module 2 – Use of Metrics to Evaluate the Impact of Workforce Practices
- Cost of turnover estimator tool
- Vehicle Operator Recruitment, Retention, and Performance in ADA Complementary Paratransit Operations
Contributing author: Michaela Boneva
