


Metrics Monday: Tracking Recruitment and Hiring
Welcome to the first post in TWC’s Metrics Monday blog series! As more human resources professionals across industries focus on “people analytics” (i.e., collecting and analyzing employee data) and employee metrics, the transit industry is also beginning to work with these data and see the benefits of such analyses. This series will cover workforce-related metrics across a range of areas, from recruitment to retention to professional development programs. We’ll begin with recruitment and hiring, the first touchpoint that most workers have with transit industry employment.
While numerous HR blogs highlight recruitment metrics, they tend to focus on office workers. In the face of widespread workforce shortage, HR teams are often forced to prioritize immediate recruiting needs over the deep data analysis required to evaluate those efforts. So why is it essential for transit agencies to track recruitment and hiring metrics? Beyond the raw numbers, these insights drive smarter decision-making, refine outreach efforts, and clearly demonstrate the return on investment for various recruitment strategies.
An online search for recruitment and hiring metrics will produce overwhelming results of possible data points to track. So, this post will focus on a few metrics that may be particularly helpful to the transit industry and its current circumstances, (i.e., ones that may not require huge amounts of staff time but can be used to improve hiring processes).
This post will cover several data areas recommended by the Society for Human Resource Management (SHRM) to help recruiters strengthen hiring processes: time-to-hire, source of hire, recruitment funnel effectiveness, and recruiter performance.
Though tracking workforce metrics is fairly new to the transit industry, some agencies have begun working more closely with employee data and using it to make informed decisions. This blog post uses CapMetro as a primary example to illustrate how these metrics can be applied to transit. At CapMetro, the Workforce Outreach department is tracking various metrics related to recruitment and outreach with hopes of expanding to new datapoints and developing up-to-date dashboards that decision-makers and leaders in the agency can understand and use. So far, CapMetro’s metric-tracking has been primarily focused on recruitment sources, the funnel of applicants from outreach to offer, and recruiter performance. Let’s take a deeper dive into some of these metrics!
Source of hire (i.e., how an applicant heard about or was recruited for the position) is a key metric that can help agencies understand where their best applicants are coming from. Effective recruitment sources can include employee referrals, ad campaigns, conferences, or job fairs. Seeing which sources produce the most candidates or the highest performing candidates, as well as tracking the costs associated with each source, can help decision-makers at an agency determine where to continue investing time and resources. For example, if an analysis of recruitment sources reveals that employee referrals have been most effective at producing successful candidates, the agency might consider options like referral bonuses to further encourage this practice, which could lead to cost-saving in other avenues that are less effective.
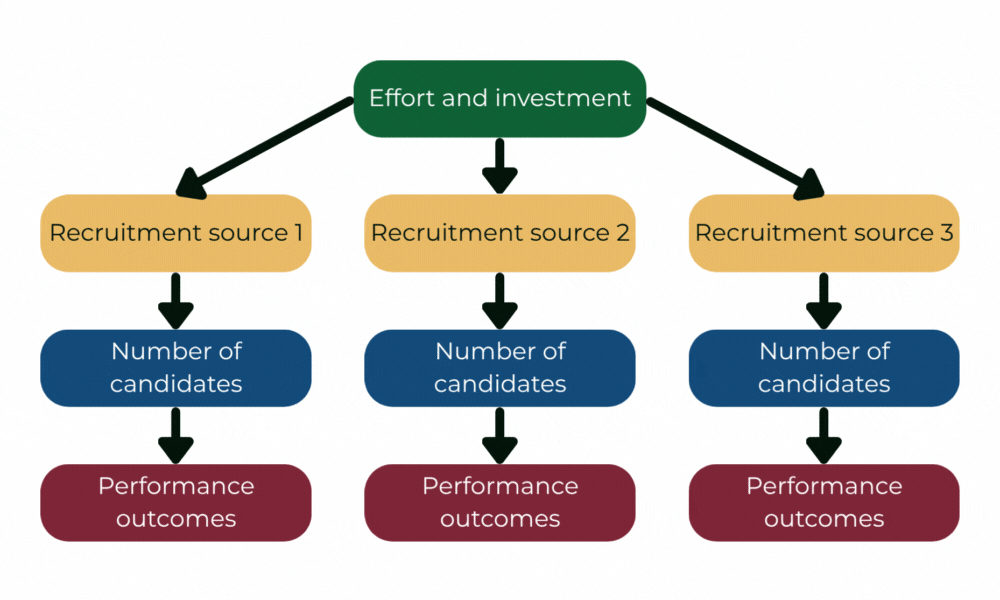
Measuring recruitment funnel effectiveness builds off the source of hire; metrics in this category follow how candidates move through different stages of the application process. Depending on the role in transit, there may be quite a few steps in the application process (e.g., for bus operators, there may be license and driving history reviews, background checks, as well as more typical steps like interviews and reference checks). It can be helpful to see where in the process candidate attrition is highest; if many candidates fail the background check, for example, recruiters may decide to try different outreach avenues or to clarify requirements in the job posting.
Source of hire and the recruitment funnel are some of the main areas in which CapMetro is tracking metrics. Adam Rosenfield, Program Manager for Workforce Outreach, and Farrin Gallardo-Castillo, Head of Talent Acquisition and Executive Recruiting, are responsible for collecting and tracking recruitment metrics at the agency. CapMetro tracked its own recruitment funnel from attendees at events, to email contacts, applicants, interviews, and finally to accepted/declined offers. This tracking process, when combined with source-of-hire information, can help determine the best source by seeing not just which sources yield contacts, but which sources yield the most accepted offers. Through tracking where successful candidates come from, Adam and Farrin found that specialized/targeted job fairs and conferences (such as veteran or maintenance-specific hiring fairs) were more likely to result in successful applicants.
The chart below uses mock data to show how a visualization of recruitment funnel effectiveness might look. Visualizing data after collecting it is key to data tracking; visualizing can uncover patterns, assist in analysis, and provide overviews to those not directly involved in tracking. In this example, while conferences provided a lot of initial connections, they ultimately account for the smallest proportion of candidates who accepted the job offer. For a decision-maker, this means that other outreach avenues might be more effective in the long run.
Another metric in recruitment funnel effectiveness is the percentage of candidates who actually complete their applications after starting them; agency staff can use that information to determine where there are pain points. At Golden Gate Transit in California, agency staff analyzed completion rates for their bus operator apprenticeship applications and compared rates across demographic groups, eventually leading to the development of partnerships with community-based organizations and the establishment of a pre-apprenticeship program to prepare participants for apprenticeship.
Related to the recruitment funnel are time-to-hire and similar metrics. Time-to-hire refers to the length of time that passes between when an applicant applies for a job opening and when the position is filled. Related metrics include time-to-fill (time that passes between when a job is approved for posting and when a candidate accepts) and time-to-start (time that passes between when a candidate accepts a job offer and when they begin training/onboarding). SHRM recommends finding a balance in these timelines: trying to fill roles too quickly may result in missing quality candidates or pursuing ones that are a poor fit, but long hiring times could cause high-performing candidates to drop out of the process.
Agency staff may track average number of days taken by each step in the hiring process to determine areas for streamlining. Tracking changes in these processes over time could highlight whether efforts to shorten certain steps have been effective. For example, the chart of mock data below shows the average number of days for hiring process steps across several years, with the beginning of a streamlining initiative marked. Again, data visualizations can spotlight patterns or reveal areas that still need improvement.
Check out TWC’s research on streamlining operator hiring practices for more information on this topic!
Agencies can also track the performance of their recruiters to determine what methods are most effective, to help identify the best recruitment sources, and to identify opportunities for skill-building and sharing of best practices among recruiters.
Previously, CapMetro’s outreach efforts lacked a mechanism to bridge the gap between initial field engagement and final hiring outcomes. Now, the agency is following up, tracking how many people a recruiter speaks to at an event and how many people apply following that. This not only helps in determining the best sources but may provide insight into what recruiting methods are most effective.
Once agencies’ staff have collected a few different recruitment and hiring metrics and visualized any patterns or trends, they can bring these visualizations and any overarching statistics together into a dashboard, which can help draw connections between different metrics or just make it easier to share the data with others in the agency. Subsequent metrics, like retention-related statistics, which will be discussed in later posts, can also be added to a dashboard to help understand how to improve hiring processes – i.e., hiring from sources that are more likely to produce candidates who receive and accept job offers and workers who are retained past the first year of employment.
If you need help getting started with tracking recruitment metrics, visualizing existing metrics, or taking your data to the next level, TWC can help. Reach out to twc@transportcenter.org.
Further reading:
- TWC’s Streamlining Operator Hiring Practices, which currently features a background research brief, highlighting best practices for recruitment that can provide inspiration for metrics to track at each step.
- Tracking Your Impact – in this presentation from TWC’s 2024 Making Connections Conference, a panelist from Metro Transit, MN discussed their tracking of recruitment metrics and analysis of interviews with successful candidates during a period of expanded hiring.
- Golden Gate Transit and ATU Local 1575 case study – while mostly about the agency’s pre-apprenticeship, apprenticeship, and mentorship programs, this also touches on the applicant analysis conducted by the agency prior to the launch of these programs
- Data Literacy Initiative from the National Center for Applied Transit Technology (N-CATT)
- How to Build a Data Dashboard Free On-Demand Course from N-CATT
- TCRP Report 162: Building a Sustainable Workforce in the Public Transportation Industry—A Systems Approach, in particular, Module 2 – Use of Metrics to Evaluate the Impact of Workforce Practices
Contributing author: Michaela Boneva